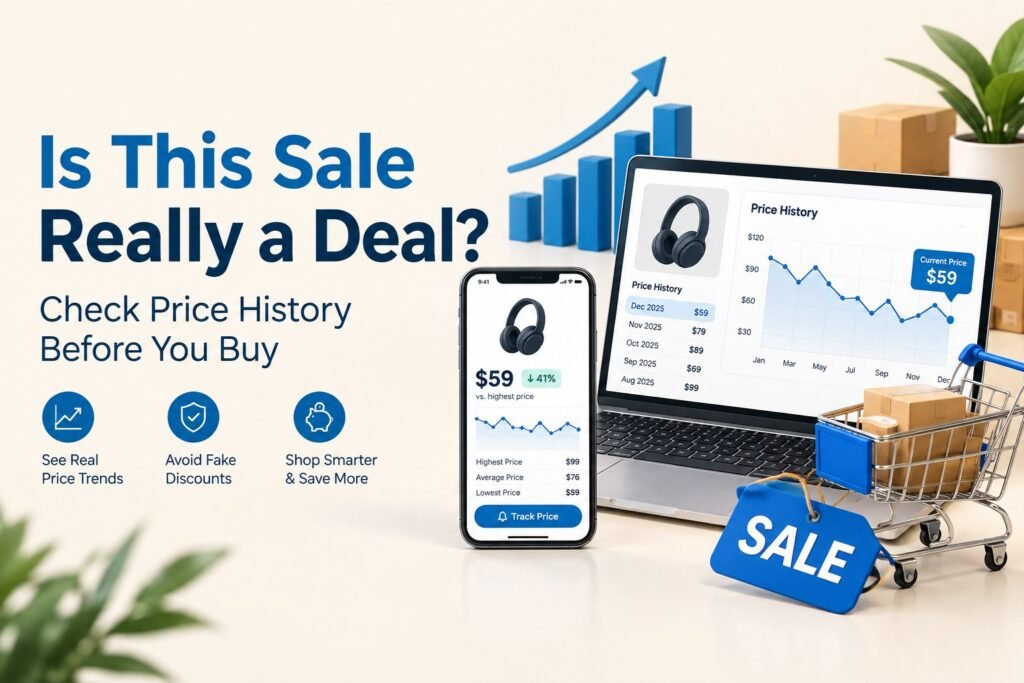
The Short Answer: A Sale Is a Deal Only If the Price History Says So
A sale is a real deal when the current price is at or near the lowest price the item has sold for over the past several months. Being lower than the “was” price on the tag isn’t enough. To find out, check the product’s price history with a price tracker. Then compare the same model at other retailers and add shipping, tax, and fees to get the total cost. If today’s price beats the item’s typical selling price and matches or comes close to its historical low, you’re looking at a genuine discount. If it only beats an inflated list price, it’s marketing.
This guide shows you how to run that check in a few minutes. It covers which tools help, how to read a price chart, and when the usual rules don’t apply.
Why “Was” Prices and Percent-Off Labels Mislead
Retailers know shoppers react to big red percentages. The number next to “Save 40%” often tells you less than it seems to. Watch for these common tactics:
- Inflated reference prices: The “original” price is a manufacturer’s suggested retail price (MSRP) that the item rarely sold for.
- Pre-sale price bumps: The price rises a few weeks before a sale event, so the “discount” only brings it back to normal.
- Permanent sales: Some items are “on sale” most of the year. At that point, the sale price is simply the regular price.
- Countdown pressure: Timers and “only 3 left” banners push you to buy before you compare.
How to Check Price History in 5 Steps
You can run this check on your phone while standing in a store aisle:
- Identify the exact product. Note the full model number, size, color, and storage capacity. A “deal” on last year’s version or a lower-spec variant isn’t the same item.
- Look up its price history. Use a price tracker or a retailer’s price-insight feature to see the price over at least the last 90 days. A full year is better if you can find it.
- Find three reference points. These are the lowest recorded price, the typical (most common) price, and the highest recent price.
- Compare across retailers. Search the model number at two or three other stores. Price matching and competitor sales often beat the “doorbuster.”
- Calculate the total cost. Add shipping, tax, membership fees, and restocking fees. Subtract any cashback, rewards, or valid discount code.
Example: A pair of headphones shows “$249, now $179.” The price history shows it sold for $199 most of the past six months and dropped to $169 twice. At $179, it’s a modest deal: better than typical, but not the best price. If you can wait, setting a price alert at $170 makes sense. If the same tag had read “was $249, now $199,” the so-called discount would just be the normal price.
Second example, where total cost changes the answer: A robot vacuum is listed as “was $399, now $279 (30% off).” Its chart shows it sat at $299 for most of the year and hit $259 once last November. This store charges $15 shipping, bringing the total to $294 before tax. A competitor sells the same model number for $289 with free shipping and 2% cashback, which works out to about $283. The store with the bigger percentage label is actually the more expensive option.
Tools That Show You the Real Price
You don’t need all of these. One or two that cover the stores you shop at most are enough.
Amazon Price Trackers
Tools like CamelCamelCamel and Keepa chart Amazon prices over time. You can also set alerts for a target price.
Search Engine Price Insights
Shopping search results often show whether a price is low, typical, or high for that product, along with recent trends.
Browser Extensions
Shopping extensions can display price history on product pages and test coupon codes at checkout. Review their privacy permissions before installing.
Wishlists and Store Alerts
Many retailers notify you when a saved item drops in price. This works well for stores that third-party trackers don’t cover.
Trackers only record the prices they observe. If a tool shows no dip, that doesn’t prove one never happened. When two tools disagree about the historical low, base your target price on the higher of the two.
Before you buy, check price history on deals like save $270 on the Dyson V8 Advanced at BIG W to confirm the discount is real.
How to Read a Price History Chart
Once you have the chart, look for patterns rather than single points:
To find the typical price, look at where the line spends most of its time. Don’t average the highest and lowest points. If an item sat at $199 for five months and spiked to $249 for two weeks, its typical price is $199, and any “discount” should be measured against that number.
Watch for outliers. A one-day plunge may have been a pricing error, a limited flash sale, or a stock clearance that sold out in minutes. Count it as a lucky exception, not a realistic target, unless the chart shows the same low more than once.
Edge Cases Where Price History Isn’t Enough
Brand-New Products
A product launched last month has little or no history. Compare it to the previous generation’s launch price and how quickly that model dropped. Early “deals” on new releases are usually small.
Bundles and Gift-With-Purchase
A bundle may look generous, but price each item separately. If you wouldn’t buy the extra accessory on its own, value it at zero.
Shrinkflation and Unit Price
For groceries and household goods, the package can shrink while the price stays the same. Compare the unit price (per ounce, per count, or per load) instead of the shelf price.
Refurbished, Open-Box, and Marketplace Sellers
A lower price from a third-party seller or on a refurbished unit isn’t the same as buying new from the retailer. Check the warranty, the return window, and seller ratings before counting it as a better deal.
Retailer-Exclusive Model Numbers
Some stores sell model numbers made only for them, which makes cross-store comparison hard. Compare the specs line by line against the closest widely sold model, and check the price history for that exact SKU.
Member-Only and App-Only Prices
Some sale prices require a paid membership, a store credit card, or checkout through the retailer’s app. If you’d pay for a membership just to get the deal, add that fee to the price. You can also spread it across the purchases you realistically expect to make there this year.
Price Adjustments After You Buy
Some retailers refund the difference if the price drops within a set period after purchase. Check the store’s current policy at checkout, and keep tracking the item after you buy. For example, Target matches its own lower price within 14 days of purchase, as we explain in does Target price match.
Timing Your Purchases in 2026
Price history charts often reveal seasonal patterns for the products you care about. Discounts tend to cluster around major sale events, including:
- Black Friday and Cyber Monday
- Large retailer membership events
- Back-to-school season
- End-of-season clearances for apparel and outdoor gear
Electronics also tend to get cheaper after a newer model is announced.
Don’t assume every event brings a new low, though. Use the chart for your specific item to see whether its best prices actually landed during those windows in previous years. Set your alerts a few weeks before a big event. That way you can spot a pre-sale price bump as it happens and know your real target before the countdown timers start.
For seasonal timing decisions, compare this method with our October vs Black Friday shopping guide. When you are ready to buy, check the TopDiscountCodez coupon directory for currently listed savings opportunities before checkout. To see how AI tools may help with price tracking, read our look at Google’s Gemini Spark AI agent.
Price history is one step in a wider routine; see our smart shopper’s checklist for the full list of checks before a seasonal sale.
FAQ
How far back should I look at price history?
At least 90 days shows you the current pricing pattern. A full 12 months is better because it captures holiday and seasonal sales, so you can tell whether today’s price is truly competitive.
Is buying slightly above the historical low still a good deal?
Often, yes. If the price is close to the low and well below the typical price, the savings from waiting may not be worth it. This is especially true if you need the item now or if the low was a brief flash sale.
What target price should I set for an alert?
Set it between the typical price and the historical low, closer to the low. If an item usually sells for $199 and has hit $169, an alert around $170–$175 will catch real dips without waiting forever for a rare record low.
Do price trackers work for in-store purchases?
Most trackers follow online listings only. Online and in-store prices at the same chain often match, but not always. While you shop, look up the item on the store’s own website or app. If the shelf price is higher, ask whether the store will match its own online price.
Can the same retailer show different prices?
Prices can differ by region, membership status, app versus website, marketplace seller, or account-specific promotion. Before buying, confirm the exact model and final checkout total on the retailer’s current product page and compare it with another seller when practical.
Summary and Next Step
To know whether a sale is really a deal, ignore the crossed-out price. Instead:
- Check at least 90 days of price history.
- Compare the sale price against the item’s typical and lowest prices.
- Confirm the exact model.
- Compare the same model at other retailers.
- Calculate the total cost after fees and discounts.
Your next step: pick one item on your wishlist today, look up its price history, and set an alert close to its historical low. Before you check out, look for a valid discount code to stack on top.